


DTI in Context: Illustrating Brain Fiber Tracts In Situ
 This page is also available in an anaglyphic 3D version.
Description:

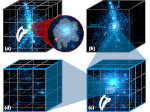
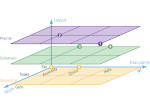
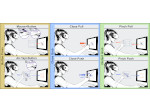
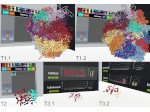
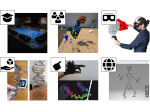
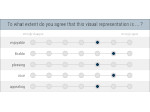
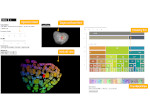
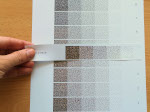
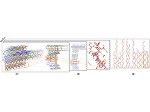
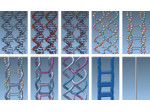
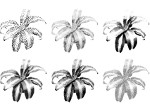
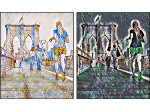
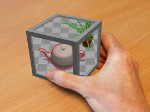
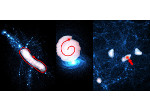
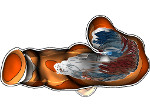
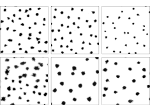
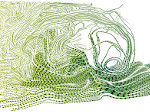
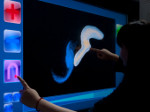
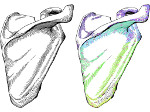
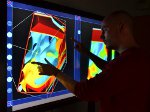
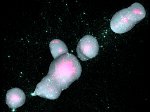
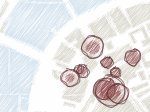
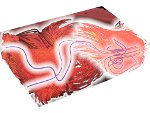
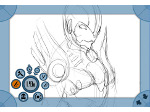
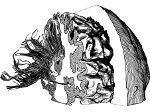
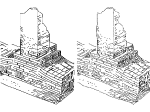
We present an interactive illustrative visualization method inspired by traditional pen-and-ink illustration styles. Specifically, we explore how to provide context around DTI fiber tracts in the form of surfaces of the brain, the skull, or other objects such as tumors. These contextual surfaces are derived from either segmentation data or generated using interactive iso-surface extraction and are rendered with a flexible, slice-based hatching technique, controlled with ambient occlusion. This technique allows us to produce a consistent and frame-coherent appearance with precise control over the lines. In addition, we provide context through cutting planes onto which we render gray matter with stippling. Together, our methods not only facilitate the interactive exploration and illustration of brain fibers within their anatomical context but also allow us to produce high-quality images for print reproduction. We provide evidence for the success of our approach with an informal evaluation with domain experts.
Paper download: 
 (4.2 MB)
Video:
Get the video:
- download the regular version (720p, AVI-MPEG4, 25.9MB),
- download the anaglyphic stereo version (720p, AVI-MPEG4, 35.6MB) for viewing with red-green or red-cyan glasses,
- watch the normal version on YouTube,
- watch the hard-coded anaglyphic stereo version on YouTube, or
- watch the true stereo version on YouTube (support for various stereo formats with slightly less quality compared to the anaglyphic video).
Fast-Forward Presentation at EuroVis 2010:
- watch the video at YouTube in HD
Demo:
You can download a demo of the DTI in Context tool (for Win32 and Linux–64bit; 10.7MB) and try it out for yourself. Note that the demo requires a graphics card capable of geometry shaders such as a GeForce 8800 or higher.
Pictures:


Additional material:
- high-resolution example images,
 normal (non-3D) version (PDF, 0.8MB)
- high-resolution example images, anaglyphic 3D version (PDF, 1.5MB)
Cross-References:
- This technique is based on the illustrative rendering of line data using depth-dependent halos, see the page on this paper.
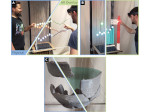
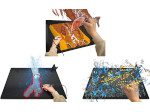
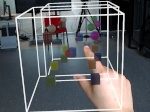
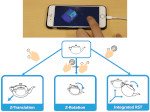
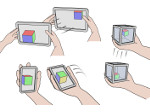
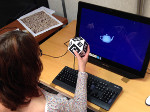
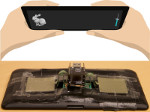
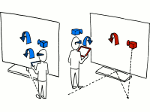
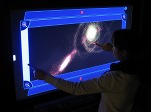
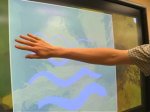
- In addition, we also created a direct-touch interaction technique for our fiber tracts plus context visualization, see the page on this interface as well.
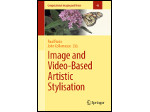
- One of the illustrations from this paper is featured on the cover of the Springer book “Visualization and Processing of Higher Order Descriptors for Multi-Valued Data”, which contains a chapter of mine on “A Survey of Illustrative Visualization Techniques for Diffusion-Weighted MRI Tractography”.
Main Reference:
| Pjotr Svetachov, Maarten H. Everts, and Tobias Isenberg (2010) DTI in Context: Illustrating Brain Fiber Tracts In Situ. Computer Graphics Forum, 29(3):1024–1032, June 2010.
| | ||
Other Reference:
| Pjotr Svetachov (2010) Illustrative Rendering and Multi-Touch Exploration of DTI Data and Its Context. Master's thesis, University of Groningen, The Netherlands, 2010. | | ||
![]()
This work was done at the Scientific Visualization and Computer Graphics Lab of the University of Groningen, the Netherlands. It is partially funded by the Netherlands Organization for Scientific Research (NWO) as part of NWO's VIEW Program: Visual Interactive Effective Worlds, theme Interactive Data Visualization (project 643.100.501).