


Interactive Illustrative Line Styles and Line Style Transfer Functions for Flow Visualization
Description:

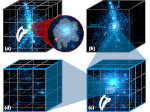
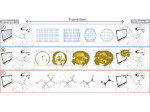
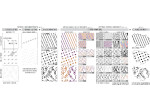
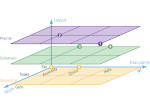
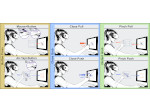
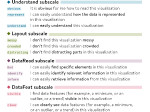
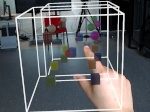
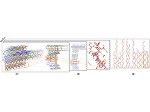
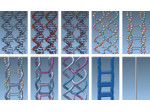
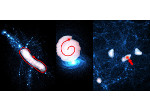
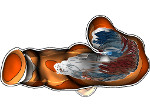
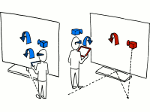
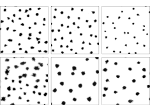
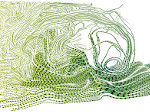
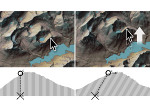
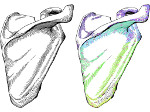
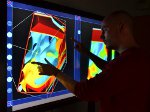
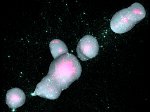
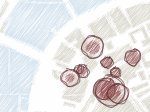
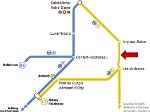
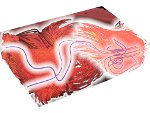
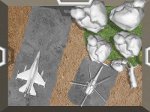
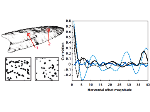
We present a flexible illustrative line style model for the visualization of streamline data. Our model partitions view-oriented line strips into parallel bands whose basic visual properties can be controlled independently. We thus extend previous line stylization techniques specifically for visualization purposes by allowing the parametrization of these bands based on the local line data attributes. Moreover, our approach supports emphasis and abstraction by introducing line style transfer functions that map local line attribute values to complete line styles. With a flexible GPU implementation of this line style model we enable the interactive exploration of visual representations of streamlines. We demonstrate the effectiveness of our model by applying it to 3D flow field datasets.
Paper download: 
 (4.7 MB)
Videos:
Get the videos:
- download the video 1 (576p25, MPEG4, 4.3MB),
- download the video 2 (576p25, MPEG4, 23.8MB),
- watch video 1 on YouTube.
- watch video 2 on YouTube.
Pictures:


Cross-References:
This technique is based on the illustrative rendering of line data using depth-dependent halos, see the page on this paper.
References:
| Maarten H. Everts, Henk Bekker, Jos B. T. M. Roerdink, and Tobias Isenberg (2015) Interactive Illustrative Line Styles and Line Style Transfer Functions for Flow Visualization. arXiv preprint 1503.05787, arXiv.org, March 2015. Extended version of a short paper at Pacific Graphics 2011.
| | ||
| Maarten H. Everts, Henk Bekker, Jos B. T. M. Roerdink, and Tobias Isenberg (2011) Illustrative Line Styles for Flow Visualization. In Bing-Yu Chen, Jan Kautz, Tong-Yee Lee, and Ming C. Lin, eds., Short Paper Proceedings of the 19th Pacific Conference on Computer Graphics and Applications (Pacific Graphics, September 21–23, Kaohsiung, Taiwan). Eurographics Association, Goslar, Germany, pages 105–110, 2011. Short paper. An extended version of this paper was published in 2015 as arXiv.org technical report # 1503.05787.
| | ||
![]()
This work was done at the Scientific Visualization and Computer Graphics Lab of the University of Groningen, the Netherlands, in collaboration with the AVIZ project group of Inria, France. It is partially funded by the Netherlands Organization for Scientific Research (NWO) as part of NWO's VIEW Program: Visual Interactive Effective Worlds, theme Interactive Data Visualization (project 643.100.501). Also see Maarten's project page.