An Illustrative Data Graphic in an 18th–19th Century Style
Description:

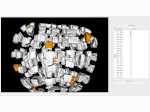
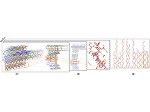
The well-known historic hand-made visualizations that were created in the 18th and 19th centuries by artists such as Charles Joseph Minard, William Playfair, Joseph Priestley, and Florence Nightingale have long been a great source of inspiration for contemporary visualization work. Tufte, in particular, praises much of this early work—such as Napoleon's march—for its graphical excellency but also its aesthetic, elegance, and technique. The specific style of the early graphics arose from a combination of hand-crafted appearance, clear and clean graphic design, precise data depiction, coupled with a storytelling layout. We present a case study in which we attempted to imitate the graphical appeal of historic infographics. Our goal was to emulate, in particular, the hand-crafted style and aesthetic for a modern personal data graphic that shows the historic evolution of research activities from the perspective of our team leader. We provide details on the type of data we chose to tell his story and how we emulated the style of historic data engravings to create a unique present on the occasion of his 50th birthday. The graphic was well received and is now permanently being exhibited.
Paper download:

 (InfoVis poster extended abstract; 3.3 MB)
- (InfoVis poster extended abstract incl. data graphic; 49.0 MB)
- (Expressive showcase extended abstract; 0.8 MB)
- (Expressive showcase extended abstract incl. data graphic; 46.5 MB)
- (Expressive poster extended abstract; 3.6 MB)
Data graphic without frame (PDF, 43.8 MB):
Data graphic including frame (PDF, 46.8 MB):
Poster presented at Expressive 2013 (PDF, 24.5 MB):
Poster presented at IEEE InfoVis 2013 (PDF, 21.4 MB):
References:
| Benjamin Bach, Pierre Dragicevic, Samuel Huron, Petra Isenberg, Yvonne Jansen, Charles Perin, Andre Spritzer, Romain Vuillemot, Wesley Willett, and Tobias Isenberg (2013) Illustrative Data Graphics in 18th–19th Century Style: A Case Study. In T.J. Jankun-Kelly, Gennady Andrienko, Ross Maciejewski, Melanie Tory, Bongshin Lee, and Heike Leitte, eds., Posters at the IEEE Conference on Visualization (IEEE VIS, October 13–18, Atlanta, GA, USA). 2013. Extended abstract and poster.
|
|   

×
BibTeX entry:
@INPROCEEDINGS{Bach:2013:IDG,
  author      = {Benjamin Bach and Pierre Dragicevic and Samuel Huron and Petra Isenberg and Yvonne Jansen and Charles Perin and Andre Spritzer and Romain Vuillemot and Wesley Willett and Tobias Isenberg},
  title       = {Illustrative Data Graphics in 18\textsuperscript{th}--19\textsuperscript{th} Century Style: A Case Study},
  booktitle   = {Posters at the IEEE Conference on Visualization (IEEE VIS, October 13--18, Atlanta, GA, USA)},
  OPTeditor   = {T.J. Jankun-Kelly and Gennady Andrienko and Ross Maciejewski and Melanie Tory and Bongshin Lee and Heike Leitte},
  year        = {2013},
  oa_hal_url  = {https://hal.science/hal-00849079},
  url         = {https://tobias.isenberg.cc/p/Bach2013IDG},
  pdf         = {https://tobias.isenberg.cc/personal/papers/Bach_2013_IDG.pdf},
}
|
| Pierre Dragicevic, Benjamin Bach, Nicole Dufournaud, Samuel Huron, Petra Isenberg, Yvonne Jansen, Charles Perin, Andre Spritzer, Romain Vuillemot, Wesley Willett, and Tobias Isenberg (2013) Visual Showcase: An Illustrative Data Graphic in an 18th–19th Century Style. In Visual Showcase at the Joint ACM/EG Symposium on Computational Aesthetics, Sketch-Based Interfaces and Modeling, and Non-Photorealistic Animation and Rendering (Expressive, July 19–20, Anaheim, CA, USA). 2013. Extended abstract and exhibition piece.
|
|
×
BibTeX entry:
@INPROCEEDINGS{Dragicevic:2013:VSI,
  author      = {Pierre Dragicevic and Benjamin Bach and Nicole Dufournaud and Samuel Huron and Petra Isenberg and Yvonne Jansen and Charles Perin and Andre Spritzer and Romain Vuillemot and Wesley Willett and Tobias Isenberg},
  title       = {Visual Showcase: An Illustrative Data Graphic in an 18\textsuperscript{th}--19\textsuperscript{th} Century Style},
  booktitle   = {Visual Showcase at the Joint ACM/EG Symposium on Computational Aesthetics, Sketch-Based Interfaces and Modeling, and Non-Photorealistic Animation and Rendering (Expressive, July 19--20, Anaheim, CA, USA)},
  year        = {2013},
  oa_hal_url  = {https://hal.science/hal-00849083},
  url         = {https://tobias.isenberg.cc/p/Bach2013IDG},
  pdf         = {https://tobias.isenberg.cc/personal/papers/Dragicevic_2013_VSI.pdf},
}
|
| Pierre Dragicevic, Wesley Willett, and Tobias Isenberg (2013) Illustrative Data Graphic Style Elements. In Posters at the Joint ACM/EG Symposium on Computational Aesthetics, Sketch-Based Interfaces and Modeling, and Non-Photorealistic Animation and Rendering (Expressive, July 19–20, Anaheim, CA, USA). 2013. Extended abstract and poster.
|
|
×
BibTeX entry:
@INPROCEEDINGS{Dragicevic:2013:IDG,
  author      = {Pierre Dragicevic and Wesley Willett and Tobias Isenberg},
  title       = {Illustrative Data Graphic Style Elements},
  booktitle   = {Posters at the Joint ACM/EG Symposium on Computational Aesthetics, Sketch-Based Interfaces and Modeling, and Non-Photorealistic Animation and Rendering (Expressive, July 19--20, Anaheim, CA, USA)},
  year        = {2013},
  oa_hal_url  = {https://hal.science/hal-00849081},
  url         = {https://tobias.isenberg.cc/p/Bach2013IDG},
  pdf         = {https://tobias.isenberg.cc/personal/papers/Dragicevic_2013_IDG.pdf},
}
|
This work was done at the AVIZ project group of INRIA, France.


