


Multiscale Unfolding: Illustratively Visualizing the Whole Genome at a Glance
Description:

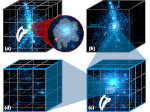
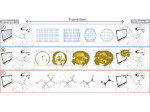
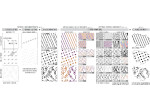
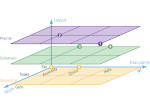
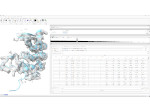
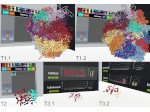
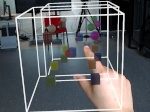
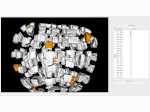
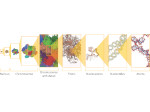
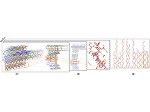
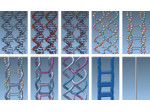
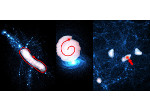
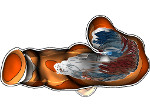
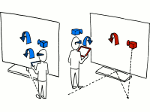
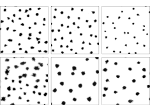
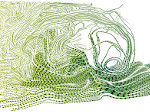
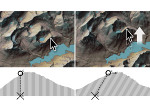
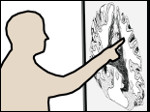
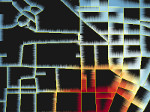
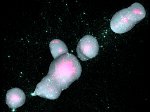
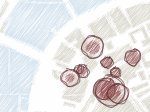
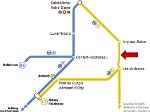
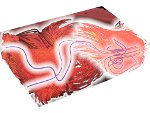
We present Multiscale Unfolding, an interactive technique for illustratively visualizing multiple hierarchical scales of DNA in a single view, showing the genome at different scales and demonstrating how one scale spatially folds into the next. The DNA's extremely long sequential structure—arranged differently on several distinct scale levels—is often lost in traditional 3D depictions, mainly due to its multiple levels of dense spatial packing and the resulting occlusion. Furthermore, interactive exploration of this complex structure is cumbersome, requiring visibility management like cut-aways. In contrast to existing temporally controlled multiscale data exploration, we allow viewers to always see and interact with any of the involved scales. For this purpose we separate the depiction into constant-scale and scale transition zones. Constant-scale zones maintain a single-scale representation, while still linearly unfolding the DNA. Inspired by illustration, scale transition zones connect adjacent constant-scale zones via level unfolding, scaling, and transparency. We thus represent the spatial structure of the whole DNA macro-molecule, maintain its local organizational characteristics, linearize its higher-level organization, and use spatially controlled, understandable interpolation between neighboring scales. We also contribute interaction techniques that provide viewers with a coarse-to-fine control for navigating within our all-scales-in-one-view representations and visual aids to illustrate the size differences. Overall, Multiscale Unfolding allows viewers to grasp the DNA's structural composition from chromosomes to the atoms, with increasing levels of “unfoldedness,” and can be applied in data-driven illustration and communication.
Paper download: 
 (25.8 MB)
Demo:
You can download a demo of the program (for Windows–x64; 1.59GB) and try it out for yourself.
Videos:
Presentation at IEEE  :
:
Fast-Forward for presentation at IEEE :
Get the videos:
- watch the paper video on YouTube
- download the paper video (MPEG4, 96.3MB)
- watch the presentation video on YouTube
- watch the fast-forward video on YouTube
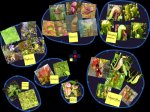
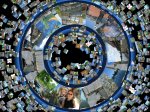
Pictures:


Cross-References:
- This work is closely related to our past work on Scale Trotter.
- This article continues our discussion of visual abstraction in visualization, also check out our initial discussion as well as our update.
Main Reference:
Other Reference:
| Sarkis Halladjian (2020) Spatially Integrated Abstraction of Genetic Molecules. PhD thesis, Université Paris-Saclay, France, December 2020. | | ||
This work was done as a collaboration between the AVIZ project group of Inria, France, the Research Unit of Computer Graphics at TU Wien, Austria, and the Visual Computing Center of KAUST, Kingdom of Saudi-Arabia.


This work was supported through the Illustrare project, funded by ANR in France and FWF in Austria.