


ScaleTrotter: Illustrative Visual Travels Across Negative Scales
Description:

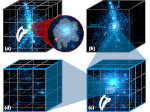
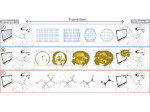
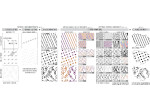
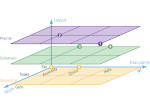
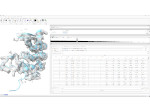
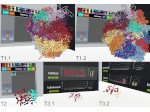
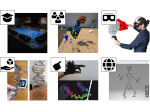
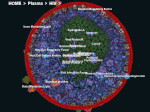
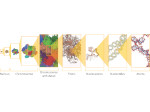
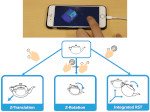
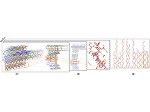
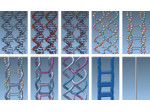
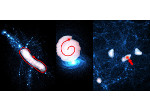
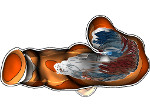
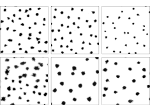
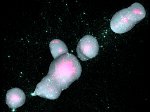
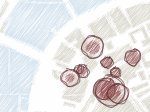
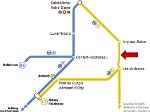
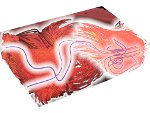
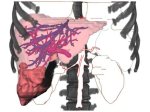
We present ScaleTrotter, a conceptual framework for an interactive, multi-scale visualization of biological mesoscale data and, specifically, genome data. ScaleTrotter allows viewers to smoothly transition from the nucleus of a cell to the atomistic composition of the DNA, while bridging several orders of magnitude in scale. The challenges in creating an interactive visualization of genome data are fundamentally different in several ways from those in other domains like astronomy that require a multi-scale representation as well. First, genome data has intertwined scale levels—the DNA is an extremely long, connected molecule that manifests itself at all scale levels. Second, elements of the DNA do not disappear as one zooms out—instead the scale levels at which they are observed group these elements differently. Third, we have detailed information and thus geometry for the entire dataset and for all scale levels, posing a challenge for interactive visual exploration. Finally, the conceptual scale levels for genome data are close in scale space, requiring us to find ways to visually embed a smaller scale into a coarser one. We address these challenges by creating a new multi-scale visualization concept using a scale-dependent camera model that controls the visual embedding of the scales into their respective parents, the rendering of a subset of the scale hierarchy, and the location, size, and scope of the view. In traversing the scales, ScaleTrotter is roaming between 2D and 3D visual representations that are depicted in integrated visuals. We discuss, specifically, how this form of multi-scale visualization is a consequence of the specific characteristics of the genome data and describe its implementation. Finally, we discuss the implications of our work to the general illustrative depiction of multi-scale data.
Paper download: 
 (14.2 MB)
Demo:
You can download a demo of the program (for Windows–x64; 1.59GB) and try it out for yourself.
Videos:
30 second preview:
paper presentation at IEEE  :
:
Get the videos:
- download the paper video (MPEG4, 193MB),
- watch the paper video on YouTube.
- watch the 30s preview video on Vimeo.
- watch the paper presentation video on Vimeo.
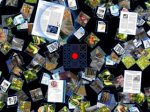
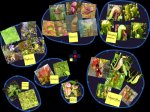
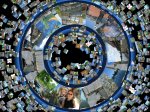
Pictures:


Cross-References:
This article continues our discussion of visual abstraction in visualization, check out our initial discussion. In addition, we also continued this work to realize a spatial control of the abstraction we call Multiscale Unfolding, check out the newer approach as well.
Main Reference:
Other Reference:
| Sarkis Halladjian (2020) Spatially Integrated Abstraction of Genetic Molecules. PhD thesis, Université Paris-Saclay, France, December 2020. | | ||
This work was done as a collaboration between the AVIZ project group of Inria, France, and the Research Unit of Computer Graphics at TU Wien, Austria.


This work was supported through the Illustrare project, funded by ANR in France and FWF in Austria.