


The Language of Infographics: Toward Understanding Conceptual Metaphor Use in Scientific Storytelling
Description:

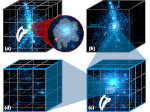
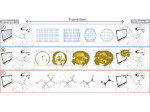
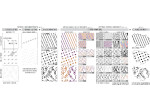
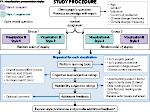
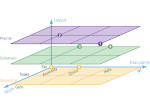
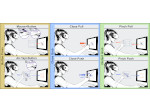
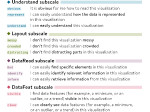
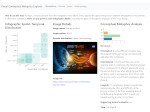
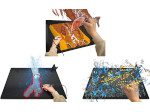
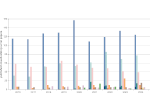
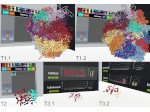
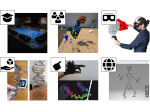
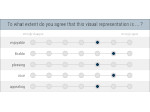
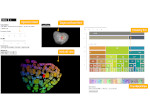
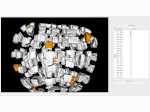
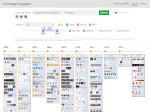
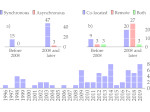
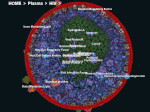
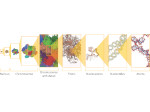
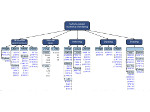
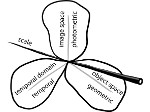
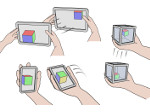
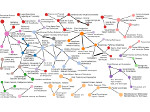
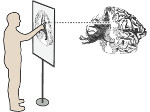
We apply an approach from cognitive linguistics by mapping Conceptual Metaphor Theory (CMT) to the visualization domain to address patterns of visual conceptual metaphors that are often used in science infographics. Metaphors play an essential part in visual communication and are frequently employed to explain complex concepts. However, their use is often based on intuition, rather than following a formal process. At present, we lack tools and language for understanding and describing metaphor use in visualization to the extent where taxonomy and grammar could guide the creation of visual components, e.g., infographics. Our classification of the visual conceptual mappings within scientific representations is based on the breakdown of visual components in existing scientific infographics. We demonstrate the development of this mapping through a detailed analysis of data collected from four domains (biomedicine, climate, space, and anthropology) that represent a diverse range of visual conceptual metaphors used in the visual communication of science. This work allows us to identify patterns of visual conceptual metaphor use within the domains, resolve ambiguities about why specific conceptual metaphors are used, and develop a better overall understanding of visual metaphor use in scientific infographics. Our analysis shows that ontological and orientational conceptual metaphors are the most widely applied to translate complex scientific concepts. To support our findings we developed a visual exploratory tool based on the collected database that places the individual infographics on a spatio-temporal scale and illustrates the breakdown of visual conceptual metaphors.
Paper download:  (4.6 MB)

Additional material:
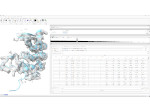
We make several items of additional material available including (1) the database of analyzed infographics and infographics that were shortlisted but excluded from the final analysis for failing to meet all inclusion criteria, (2) the sources of our exploratory tool visualizing infographics distribution and visual conceptual metaphor analysis, and (3) the keywords we used in initial searches for infographics. Find these in the following OSF repository: osf.io/8xrjm.

Software:
The tool source code is also available at github.com/lauragarrison87/metaphorTool.
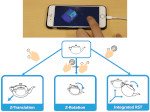
Demo:
We also have a live version of our exploratory tool for visualizing infographics distribution and visual conceptual metaphor analysis.
Videos:
30s preview at IEEE  :
:
presentation at IEEE :
Get the videos:
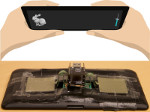
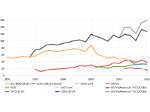
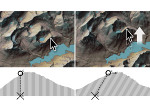
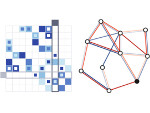
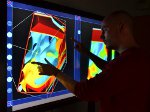
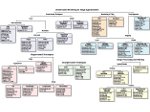
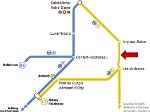
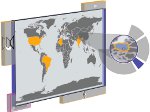
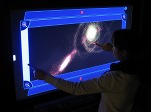
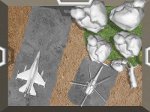
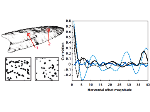
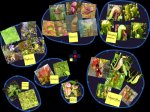
Pictures:
(these images as well as others from the paper that are our own are available under a  CC-BY 4.0 license, see the license statement at the end of the paper)
Reference:
This work was done at and in collaboration with the Visualization group of University of Bergen, Norway, as well as in collaboration with the Visual Computing and Visual Analytics team of the University of Rostock, Germany, and the Department of Visual Computing of Masaryk University, Czech Republic.