


Illustrative Molecular Visualization with Continuous Abstraction
 Best Abstract Award at BioVis 2011 for the poster abstract that extends the basic technique
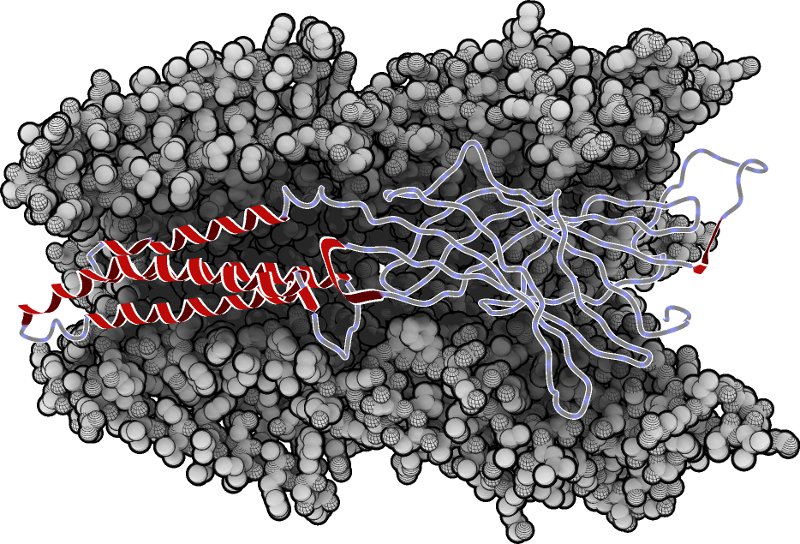
Description:
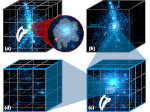
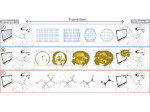
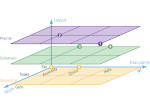
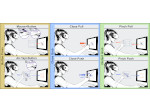
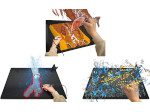
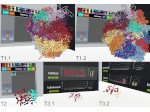
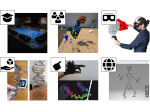
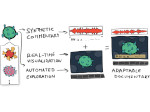
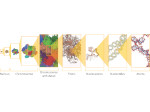
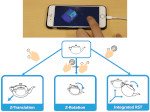
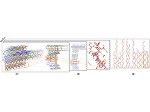
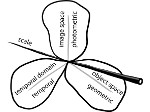
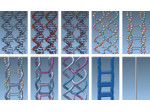
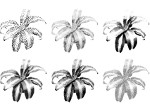
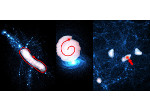
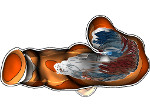
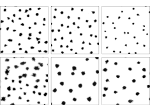
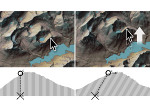
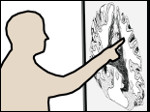
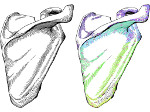
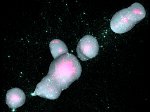
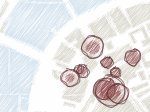
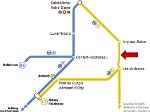
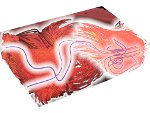
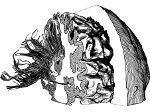
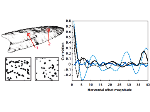
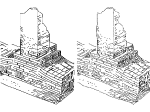
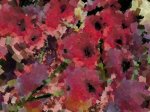
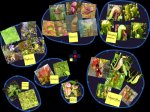
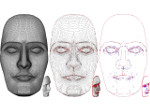
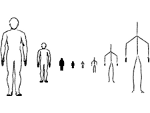
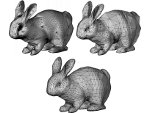
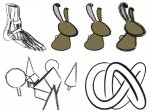
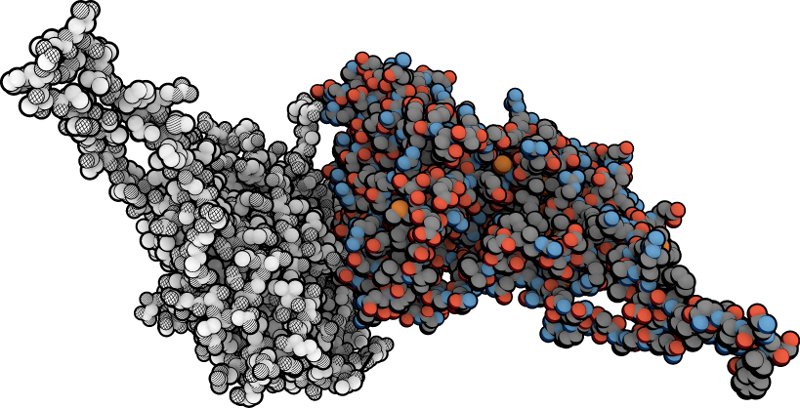
Molecular systems may be visualized with various degrees of structural abstraction, support of spatial perception, and ‘illustrativeness.’ In this work we propose and realize methods to create seamless transformations that allow us to affect and change each of these three parameters individually. The resulting transitions give viewers a dedicated control of abstraction in illustrative molecular visualization and, consequently, allow them to seamlessly explore the resulting abstraction space for obtaining a fundamental understanding of molecular systems.We show example visualizations created with our approach and report informal feedback on our technique from domain experts.
Paper download: 
 (7.6 MB)
Poster abstract:  (4.8 MB)
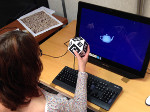
Demo:
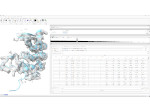
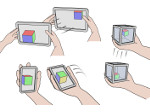
You can download a demo of the illustrative molecular visualization technique (for Win32, 32bit Linux, and 64bit Linux, 2.6MB). To be able to run the demo an nVidia graphics card is required that is capable of geometry shaders. For example, a GeForce 8800 or better should work.
Video:
Get the video:
Pictures:


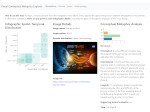
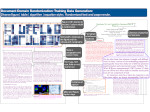
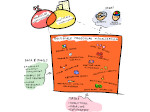
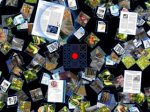
Poster presented at BioVis 2011 (received the Best Abstract Award):

Fast-Forward at BioVis 2011:
Get the fast-forward video:
Additional material:
- BioVis 2011 2-page extended abstract that extends the original technique (PDF, 4.8MB)
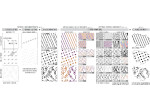
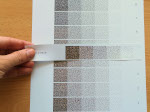
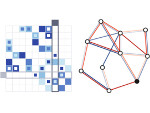
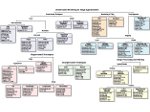
- larger example images and abstraction space matrix (PDF, 7.4MB)
- larger example images and abstraction space matrix, large version (PDF, 23.4MB)
- Slides from the presentation at EuroVis 2011 (PDF, 4.8MB)
Cross-Reference:
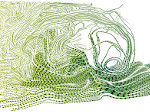
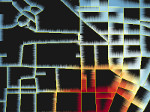
We also developed a related technique for abstracting several levels of nested flow visualizations, see the page about this illustrative rendering technique as well.
Main Reference:
| Matthew van der Zwan, Wouter Lueks, Henk Bekker, and Tobias Isenberg (2011) Illustrative Molecular Visualization with Continuous Abstraction. Computer Graphics Forum, 30(3):683–690, May 2011.
| | ||
Other References:
| Matthew van der Zwan (2011) An Abstraction Space for Molecular Visualization. Term project report, University of Groningen, The Netherlands, 2011. | | ||
This work was done at the Scientific Visualization and Computer Graphics Lab of the University of Groningen, the Netherlands.