


Data Visualization on Interactive Surfaces: A Research Agenda
Description:
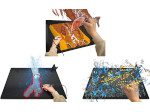
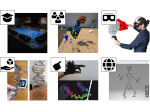
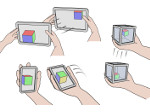
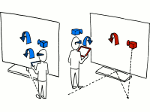
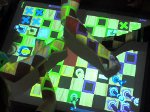
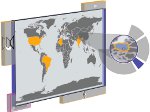
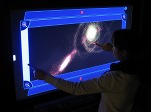
Interactive tabletops and surfaces (ITS) provide new opportunities for the analysis and communication of data using visualizations. In particular in consumer electronics, new forms of computing devices that go beyond the possibilities of desktop screen-, mouse-, and keyboard-based systems are becoming an important attractor. Touch devices, for example, promise to be easier or more comfortable to use and are often thought to be more “intuitive.” Also, it was shown that touch interaction can outperform mouse input for target selection, that it can foster awareness in collaborative settings, and that it provides important somesthetic feedback. In visualization, display medium and data interaction are well recognized as important factors for supporting insight extraction from the depicted data. As visualization practitioners we should, therefore, embrace and explore the possibilities that ITS offer. Yet, as tabletops and surfaces are slowly becoming part of our everyday environments, we still have numerous open research questions to solve at the intersection of visualization and ITS, including:
- How can ITS contribute to efficient, effective, and satisfactory data analysis with visualizations—what value do ITS have for data exploration with visualizations?
- What are the design challenges for visualization use on ITS of varying size and configuration and how can we meet them?
- How do visualizations and applications have to change to take into account novel usage contexts that ITS afford, such as collaborative data analysis?
In an effort to explore this research space, we held a workshop on Data Exploration on Interactive Surfaces (DEXIS) at the ACM Tabletop and Interactive Surfaces (ITS 2011) conference in Kobe, Japan. The goals of this viewpoint article are to report on our results and to propose an initial research agenda for information visualization, scientific visualization, and visual analytics on interactive tabletops and surfaces.
Paper download:  (2.9 MB)
Cross-References:
The discussion in this viewpoint article relates to a number of projects/papers I have worked on, including the following:
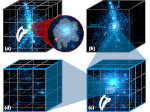
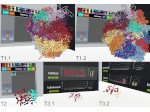
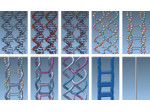
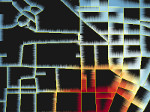
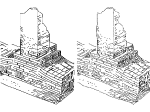
- Re-imagining the Interaction Paradigm for Scientific Visualization
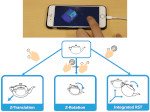
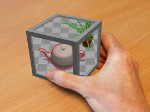
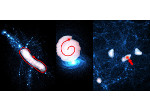
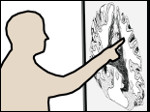
- Touch Interaction with 3D Scientific Visualizations
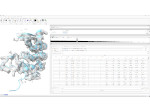
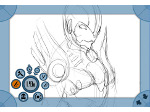
- FI3D: Direct-Touch Interaction for the Exploration of 3D Scientific Visualization Spaces
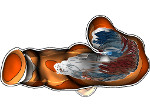
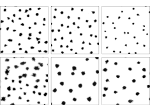
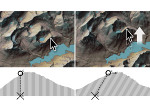
- Efficient Structure-Aware Selection Techniques for 3D Point Cloud Visualizations with 2DOF Input
- A Design Study of Direct-Touch Interaction for Exploratory 3D Scientific Visualization
- Integrating 2D Mouse Emulation with 3D Manipulation for Visualizations on a Multi-Touch Table
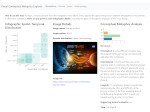
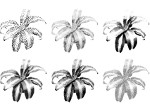
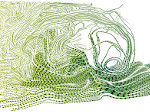
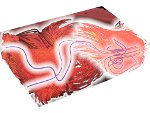
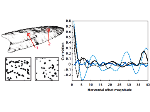
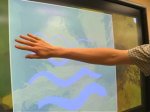
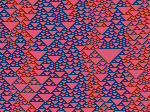
- Interactive Exploratory Visualization of 2D Vector Fields
Main Reference:
Reference for the DEXIS Workshop:

This work was done at and in collaboration with the AVIZ project group of INRIA, France, the Scientific Visualization and Computer Graphics Lab of the University of Groningen, the Netherlands, and the LIMSI lab at CNRS, France, together with collaborators at other institutions.