Visualization as Seen Through its Research Paper Keywords
Description:
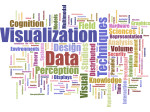
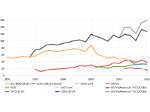
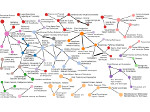
We present the results of a comprehensive multi-pass analysis of visualization paper keywords supplied by authors for their papers published in the IEEE Visualization conference series (now called IEEE VIS) between 1990--2015. From this analysis we derived a set of visualization topics that we discuss in the context of the current taxonomy that is used to categorize papers and assign reviewers in the IEEE VIS reviewing process. We point out missing and overemphasized topics in the current taxonomy and start a discussion on the importance of establishing common visualization terminology. Our analysis of research topics in visualization can, thus, serve as a starting point to (a) help create a common vocabulary to improve communication among different visualization sub-groups, (b) facilitate the process of understanding differences and commonalities of the various research sub-fields in visualization, (c) provide an understanding of emerging new research trends, (d) facilitate the crucial step of finding the right reviewers for research submissions, and (e) it can eventually lead to a comprehensive taxonomy of visualization research. One additional tangible outcome of our work is an online query tool (http://keyvis.org/) that allows visualization researchers to easily browse the 3952 keywords used for IEEE VIS papers since 1990 to find related work or make informed keyword choices.
Paper download:  (9.5 MB)
Demo:
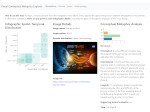
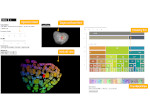
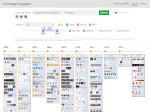
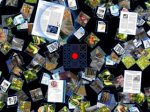
The keyvis.org site is sort of a demo of a part of our analysis, it allows you to explore the keyword dataset.
Video:
30 second paper preview at IEEE  2016:
2016:
conference presentation at IEEE  2016:
2016:
30 second poster preview at IEEE  2014:
2014:
Get the videos:
- watch the video on YouTube.
- watch the 30s paper preview on Vimeo.
- watch the paper talk on Vimeo.
- watch the 30s poster preview on Vimeo.
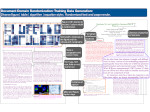
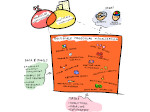
Poster presented at IEEE  2014:
2014:
Additional material:
- keyvis.org—an online tool to explore our keyword dataset
- document with additional charts and results (PDF, 3.1 MB; please note that the original version had a small mistake in a few of the graphs which have been corrected in this version)
- R analysis code and data files
- archive with additional interactive charts and a summary of parts of the analysis process (ZIP, 10.1 MB; please note that the original version had a small mistake in a few of the graphs which have been corrected in this version)
Cross-reference:
- also see the dataset of visualization publications that we helped to prepare
- also see Petra's project page
Main reference:
| Petra Isenberg, Tobias Isenberg, Michael Sedlmair, Jian Chen, and Torsten Möller (2017) Visualization as Seen Through its Research Paper Keywords. IEEE Transactions on Visualization and Computer Graphics, 23(1):771–780, January 2017. An earlier version was published on arXiv.org (# 1408.3297). | | ||
Other references:
| Petra Isenberg, Tobias Isenberg, Michael Sedlmair, Jian Chen, and Torsten Möller (2014) Toward a Deeper Understanding of Visualization Through Keyword Analysis. Technical report RR-8580, Inria, August 2014. For an updated version see the paper at IEEE VIS 2016. | | ||
This work was a collaboration between the AVIZ project group of Inria, France, the Visualization and Data Analysis research group at the University of Vienna, Austria, and the Computer Science and Electrical Engineering department of the University of Maryland, Baltimore County, USA.
