


Bristle Maps: A Multivariate Abstraction Technique for Geovisualization
Description:

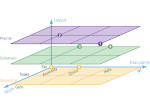
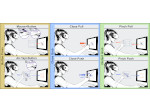
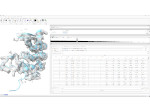
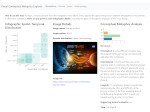
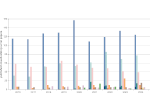
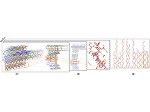
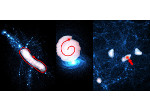
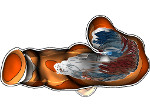
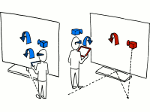
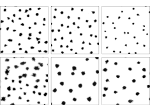
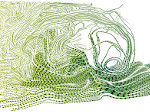
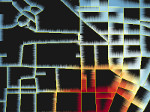
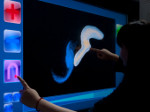
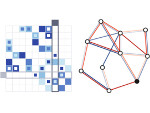
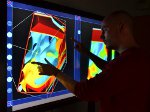
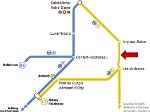
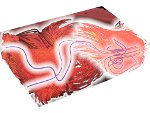
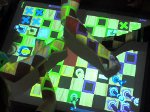
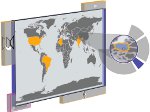
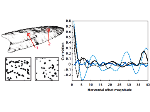
We present Bristle Maps, a novel method for the aggregation, abstraction, and stylization of spatiotemporal data that enables multi-attribute visualization, exploration, and analysis. This visualization technique supports the display of multi-dimensional data by providing users with a multi-parameter encoding scheme within a single visual encoding paradigm. Given a set of geographically located spatiotemporal events, we approximate the data as a continuous function using kernel density estimation. The density estimation encodes the probability that an event will occur within the space over a given temporal aggregation. These probability values, for one or more set of events, are then encoded into a bristle map. A bristle map consists of a series of straight lines that extend from, and are connected to, linear map elements such as roads, train, subway lines, etc. These lines vary in length, density, color, orientation, and transparency—creating the multivariate attribute encoding scheme where event magnitude, change, and uncertainty can be mapped as various bristle parameters. This approach increases the amount of information displayed in a single plot and allows for unique designs for various information schemes. We show the application of our bristle map encoding scheme using categorical spatiotemporal police reports. Our examples demonstrate the use of our technique for visualizing data magnitude, variable comparisons, and a variety of multivariate attribute combinations. To evaluate the effectiveness of our bristle map, we have conducted quantitative and qualitative evaluations in which we compare our bristle map to conventional geovisualization techniques. Our results show that bristle maps are competitive in completion time and accuracy of tasks with various levels of complexity.
Paper download:  (19.1 MB)
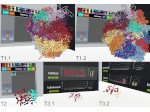
Pictures:


Cross-Reference:
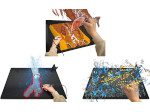
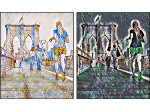
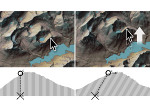
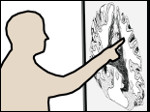
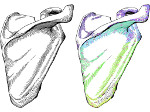
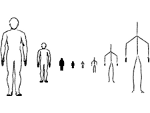
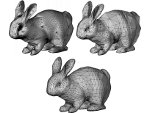
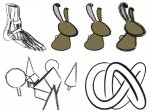
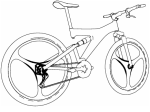
This paper is visually inspired by my earlier Visual Abstraction and Stylization of Maps work.
Main Reference:
This work was a collaboration between the Purdue University Rendering and Perceptualization Lab (PURPL) at Purdue University, USA, the School of Computing, Informatics & Decision Systems Engineering of Arizona State University, USA, the AVIZ project group of INRIA, France, the Scientific Visualization and Computer Graphics Lab of the University of Groningen, the Netherlands, and the LIMSI lab at CNRS, France.