


Occlusion-free Blood Flow Animation with Wall Thickness Visualization
Description:

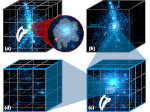
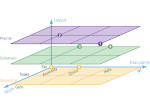
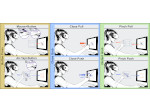
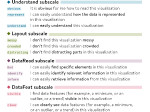
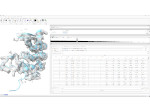
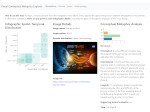
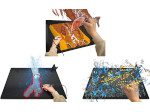
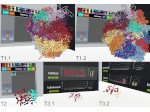
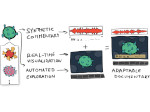
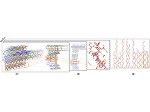
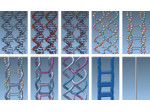
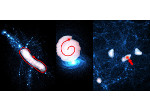
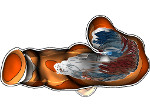
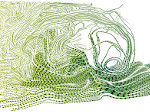
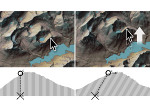
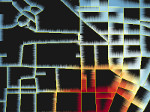
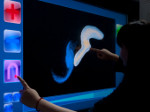
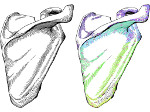
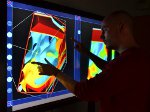
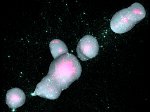
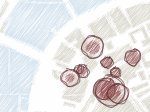
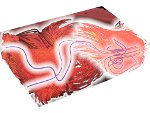
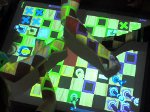
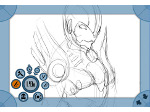
We present the first visualization tool that combines pathlines from blood flow and wall thickness information. Our method uses illustrative techniques to provide occlusion-free visualization of the flow. We thus offer medical researchers an effective visual analysis tool for aneurysm treatment risk assessment. Such aneurysms bear a high risk of rupture and significant treatment-related risks. Therefore, to get a fully informed decision it is essential to both investigate the vessel morphology and the hemodynamic data. Ongoing research emphasizes the importance of analyzing the wall thickness in risk assessment. Our combination of blood flow visualization and wall thickness representation is a significant improvement for the exploration and analysis of aneurysms. As all presented information is spatially intertwined, occlusion problems occur. We solve these occlusion problems by dynamic cutaway surfaces. We combine this approach with a glyph-based blood flow representation and a visual mapping of wall thickness onto the vessel surface. We developed a GPU-based implementation of our visualizations which facilitates wall thickness analysis through real-time rendering and flexible interactive data exploration mechanisms. We designed our techniques in collaboration with domain experts, and we provide details about the evaluation of the technique and tool.
Paper download:  (7.4 MB)
Videos:
30 second preview:
paper presentation video at SciVis 2015:
Get the videos:
- download the video (720p30, MPEG4, 55.5MB),
- watch the video on YouTube,
- watch the 30s preview on Vimeo,
- watch the paper presentation video on Vimeo.
Pictures:


Reference:
This work was done at the AVIZ project group of Inria, France.