


Depth-Dependent Halos: Illustrative Rendering of Dense Line Data


 This page is also available in an anaglyphic 3D version.
Description:

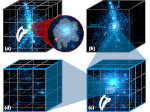
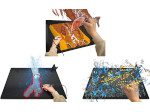
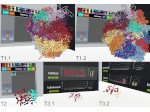
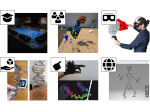
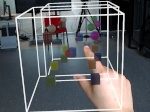
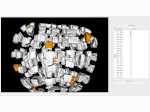
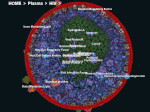
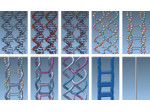
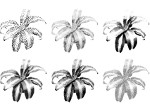
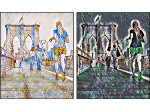
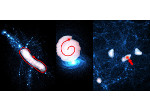
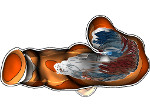
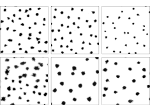
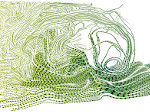
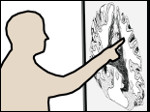
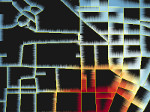
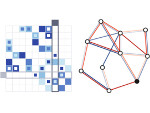
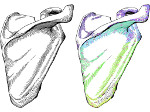
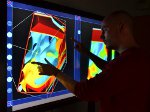
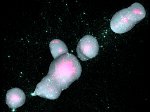
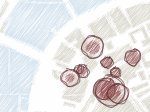
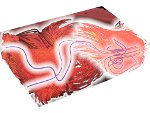
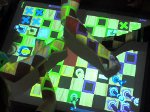
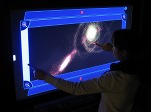
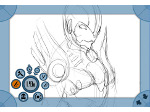
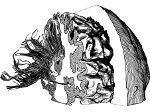
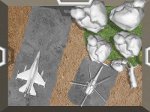
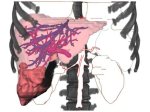
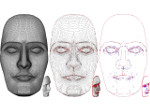
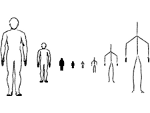
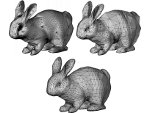
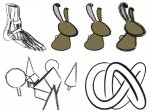
We present a technique for the illustrative rendering of 3D line data at interactive frame rates. We create depth-dependent halos around lines to emphasize tight line bundles while less structured lines are de-emphasized. Moreover, the depth-dependent halos combined with depth cueing via line width attenuation increase depth perception, extending techniques from sparse line rendering to the illustrative visualization of dense line data. We demonstrate how the technique can be used, in particular, for illustrating DTI fiber tracts but also show examples from gas and fluid flow simulations and mathematics as well as describe how the technique extends to point data. We report on an informal evaluation of the illustrative DTI fiber tract visualizations with domain experts in neurosurgery and tractography who commented positively about the results and suggested a number of directions for future work.
Paper download:  (6.9 MB)
Video:
Get the video:
- download the regular version (720p, AVI-MPEG4, 42.2MB),
- download the anaglyphic stereo version (720p, AVI-MPEG4, 49.2MB) for viewing with red-green or red-cyan glasses,
- watch the normal version on YouTube,
- watch the hard-coded anaglyphic stereo version on YouTube, or
- watch the true stereo version on YouTube (support for various stereo formats with slightly less quality compared to the anaglyphic video).
Fast-Forward presentation at VIS 2009:
Get the video:
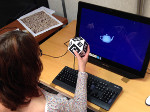
Demo:
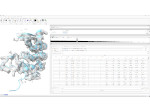
You can download a demo of the Depth-Dependent Halos tool (for Win32, Mac OS X–Intel, Linux–32bit, and Linux–64bit; 27.3MB) and try it out for yourself. There is also example code to read or write the used datasets.
Pictures:


(these images have been newly created with the demo and are, unlike the ones from the paper, available under a  CC-BY 4.0 license—but you can also always create new images for yourself using the demo)
Additional material:
- high-resolution example images,
 normal (non-3D) version (PDF, 3.8MB)
- high-resolution example images, anaglyphic 3D version (PDF, 7.4MB)
- slides from the Vis 2009 presentation (PDF, 9.9MB)
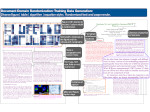
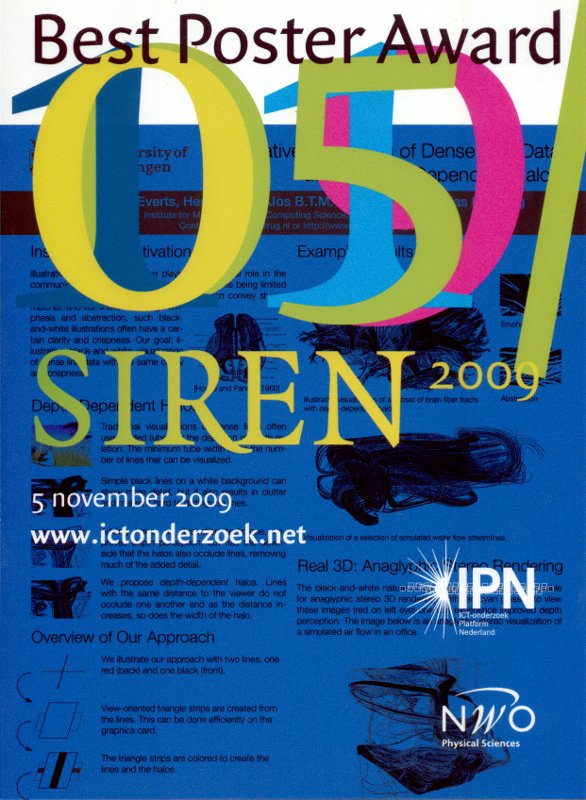
Poster presented at SIREN 2009 (received the Best Poster Award):

Cross-Reference:
- This technique was later used for the illustration of DTI brain fibers in context, see the page on this paper as well.
External References and Applications:
- Christopher Denter combined the technique with ambient occlusion.
- The perspective viewport of the Unreal Engine has implemented depth-dependent halos for wireframe rendering!
Main Reference:
Other References:
Maarten H. Everts, Henk Bekker, Jos B. T. M. Roerdink, and Tobias Isenberg (2015) Interactive Illustrative Line Styles and Line Style Transfer Functions for Flow Visualization. arXiv preprint 1503.05787, arXiv.org, March 2015. Extended version of a short paper at Pacific Graphics 2011.
 | | ||
| Maarten H. Everts, Henk Bekker, Jos B. T. M. Roerdink, and Tobias Isenberg (2011) Illustrative Line Styles for Flow Visualization. In Bing-Yu Chen, Jan Kautz, Tong-Yee Lee, and Ming C. Lin, eds., Short Paper Proceedings of the 19th Pacific Conference on Computer Graphics and Applications (Pacific Graphics, September 21–23, Kaohsiung, Taiwan). Eurographics Association, Goslar, Germany, pages 105–110, 2011. Short paper. An extended version of this paper was published in 2015 as arXiv.org technical report # 1503.05787.
| | ||
| Maarten H. Everts, Roel W. C. P. Verstappen, Henk Bekker, Jos B. T. M. Roerdink, and Tobias Isenberg (2011) Visualizing Streamlines using Depth-Dependent Halos. In Posters of the 64th Annual Meeting of the American Physical Society’s Division of Fluid Dynamics (November 20–22, Baltimore, USA). 2011. Poster. Also see the short paper at Pacific Graphics 2011.
| | ||
| Maarten H. Everts, Henk Bekker, Jos B. T. M. Roerdink, and Tobias Isenberg (2011) Flow Visualization using Illustrative Line Styles. In Proceedings of the National ICT.OPEN/SIREN Workshop (November 14–15, Veldhoven, The Netherlands)., article no. 33, 6 pages, 2011. Nominated for Best Paper. Also see the short paper at Pacific Graphics 2011.
| | ||
| Maarten H. Everts, Henk Bekker, Jos B. T. M. Roerdink, and Tobias Isenberg (2010) Illustrative Rendering of Dense Line Data. In Proceedings of the Sixteenth Annual Conference of the Advanced School for Computing and Imaging (ASCI CONFERENCE, November 1–3, Veldhoven, The Netherlands)., article no. 13, 8 pages, 2010. Also see the paper at VIS 2009. | | ||
| Maarten H. Everts (2011) Visualization of Dense Line Data. PhD thesis, University of Groningen, The Netherlands, 2011. | | ||
![]()
This work was done at the Scientific Visualization and Computer Graphics Lab of the University of Groningen, the Netherlands. It is partially funded by the Netherlands Organization for Scientific Research (NWO) as part of NWO's VIEW Program: Visual Interactive Effective Worlds, theme Interactive Data Visualization (project 643.100.501).